Skip to content

What changed in the terrain, how much and when.

Compare two campaigns and see where the terrain changed, with area, volume and mass balance, and the evidence behind each number.

TerraDelta: comparison of dates with volume, cut and fill
On screen

TerraDelta as it is.

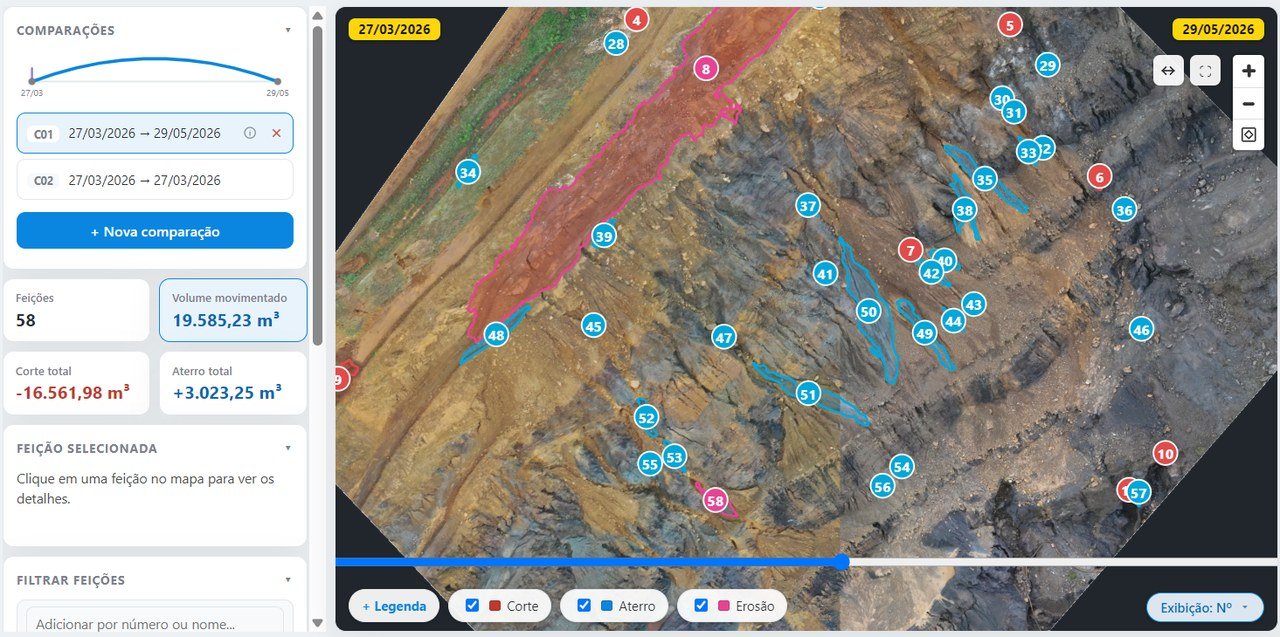
Comparison of two campaigns in TerraDelta, with numbered features over the orthophoto and the totals of cut, fill and volume moved
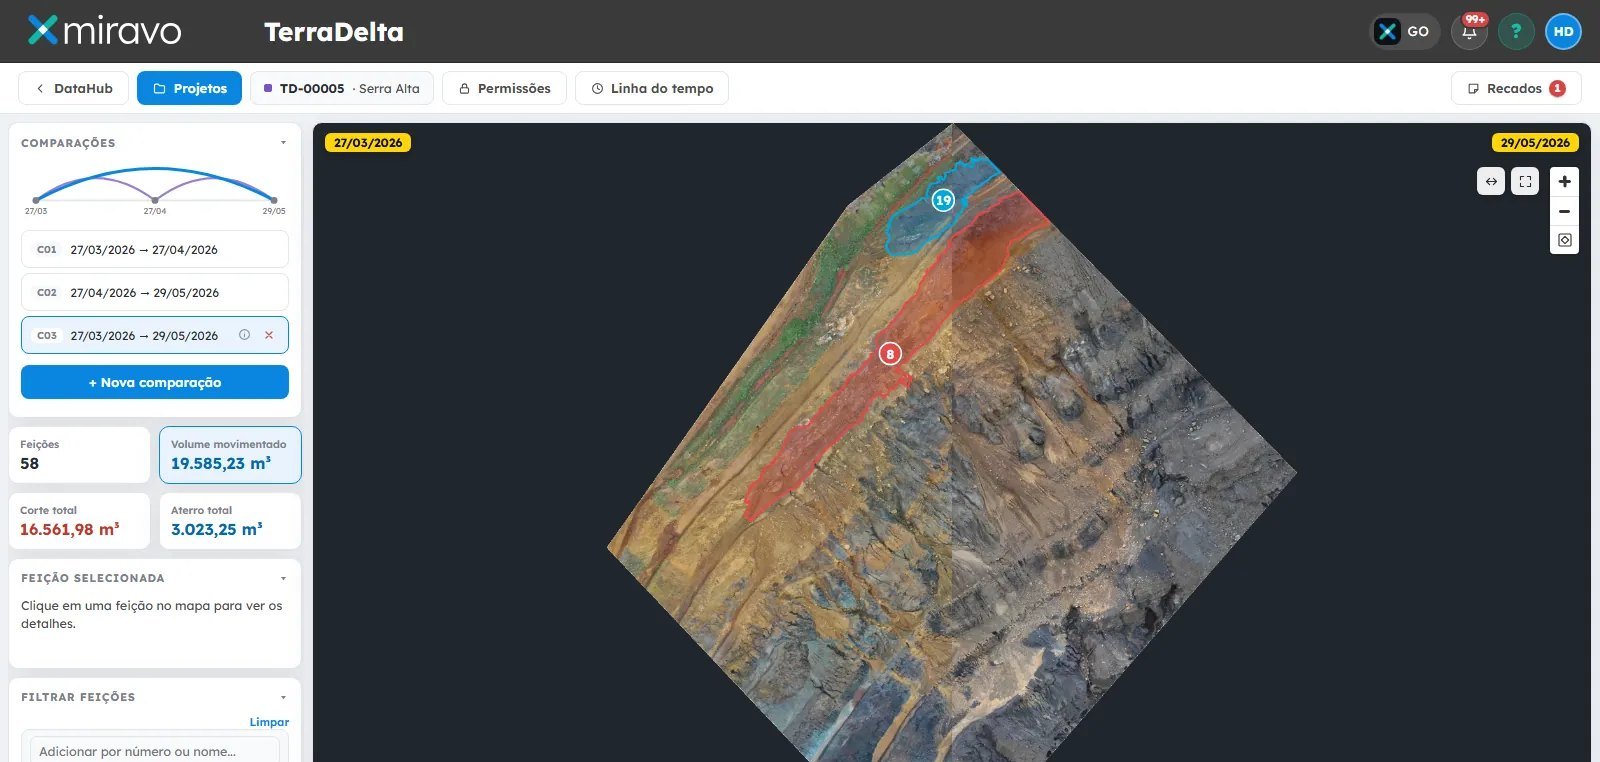
Comparison of dates with numbered features, cut, fill and volume moved
How it works

Four steps, all on record.

01

Choose two campaigns

Of the same site, already in the DataHub library.

02

Detect

The sliding curtain overlays the two dates, and the changes become numbered features: cut, fill and erosion.

03

Quantify

Area, volume and mass balance on the terrain model.

04

Review as a team

The whole comparison opens in ProColab for the team to review together.

For technical staff

Volume measured on the terrain model, not estimated.

For managers

A number that can be explained today and five years from now.

Specifications

What TerraDelta does.

Input
Two campaigns of the same site, as terrain models (DSM or DTM), which DataHub can also generate from the point cloud
Detection
Changes classified into unique features: cut, fill and erosion
Measurements
Area, volume and mass balance
Review
Sliding curtain and timeline; the comparison opens in ProColab
Output
PDF report and spreadsheet; DXF, SHP, KML, KMZ, GeoJSON and GeoTIFF
FAQ

About comparing dates.

How do you calculate cut and fill volume between two surveys?
By comparing the two surfaces. TerraDelta compares two survey campaigns of the same site, detects and numbers the changes (cut, fill and erosion) and calculates area, volume and mass balance on the terrain model. ProColab also calculates volume by cross-sections or by surface comparison.
How do you identify erosion and terrain changes between campaigns?
With TerraDelta's comparison of dates: each change becomes a numbered and classified feature (cut, fill, erosion), with area and volume, and the sliding curtain shows before and after.
How do you prove the volume moved in an audit?
With the calculation done on the terrain model and every step recorded: the two campaigns, and the source, date and owner of each dataset are kept, and the result can be exported.
All questions →
Next step

The terrain changed. Miravo shows where, how much and when.

A 30-minute online demo, with a survey from your operation on the map.

Request a demo