Skip to content

The team on the same data, with no attachments.

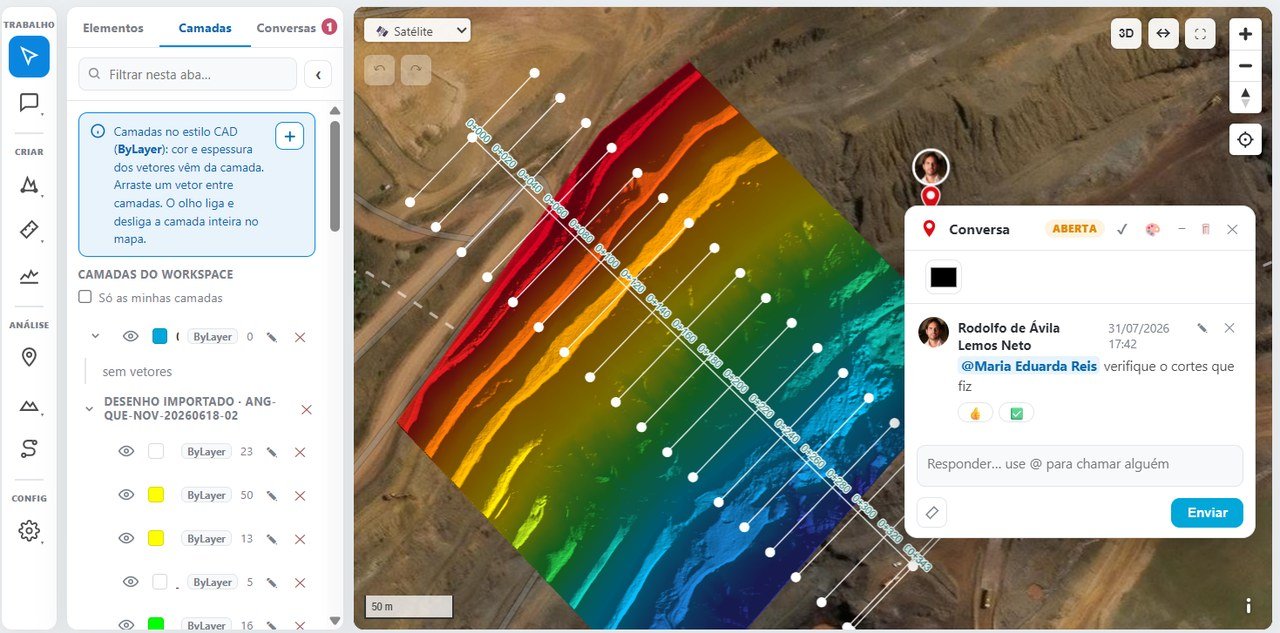
Management, engineering and suppliers work on the same survey, in the browser and on the phone, without waiting for the specialist.

ProColab: layers, markups and conversations on the project
On screen

ProColab as it is.

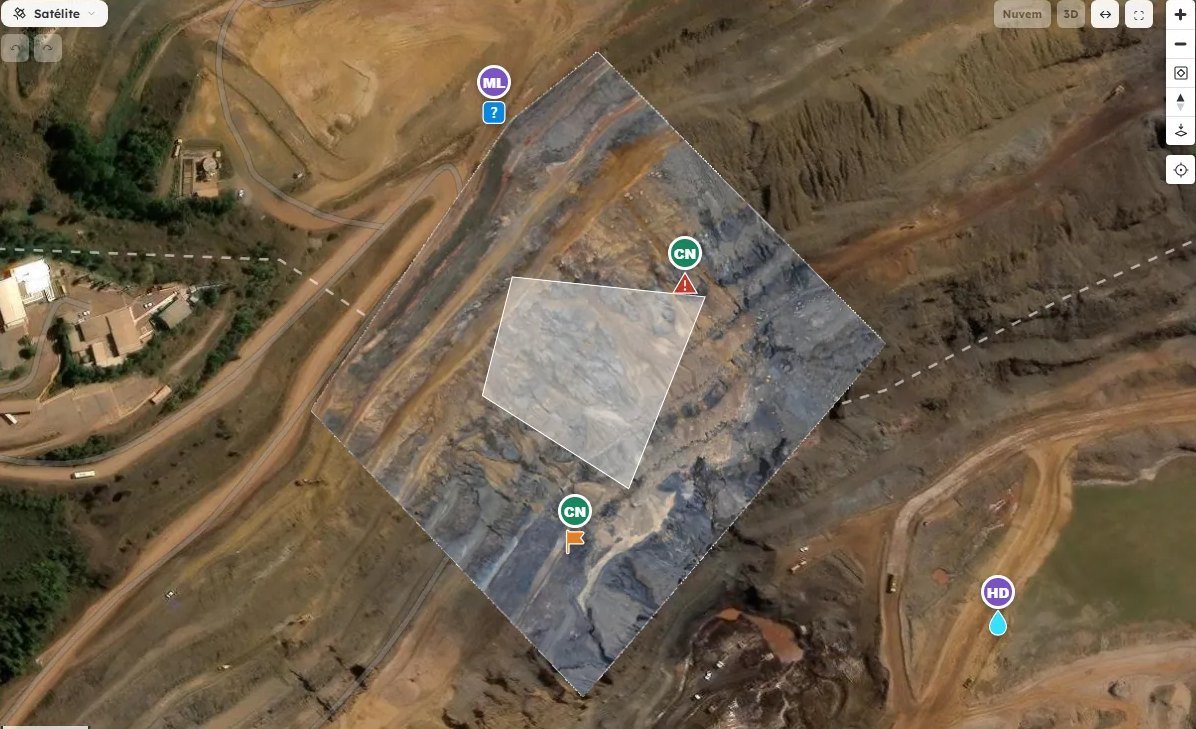
Alerts, questions and tasks marked on the project map, over the orthophoto
Alerts, questions and tasks anchored to the spot on the map
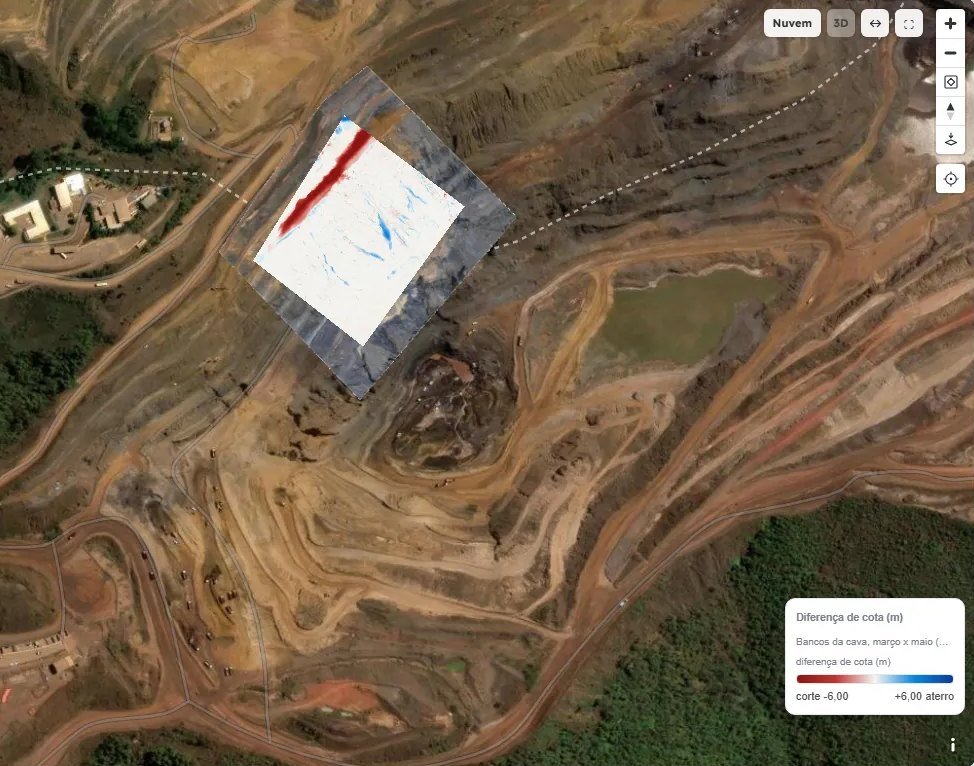
Elevation difference map between two campaigns, with cut in red and fill in blue
Elevation difference between campaigns, with cut and fill
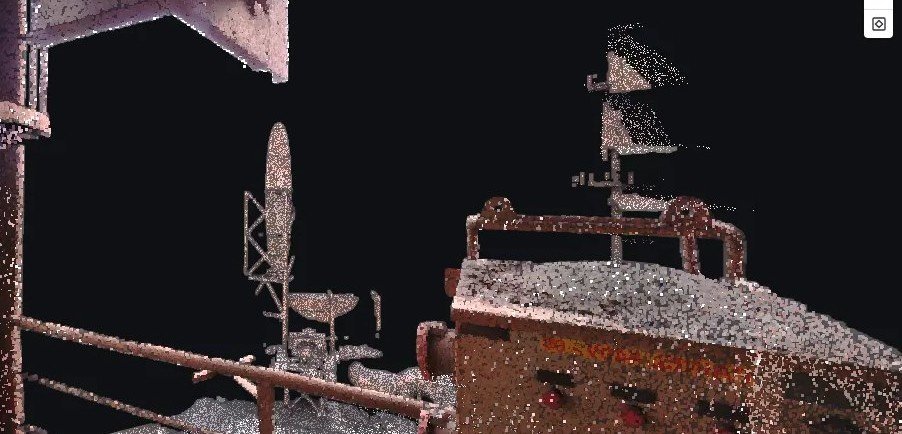
Laser scanner point cloud of an industrial facility, opened in the browser
Laser scanner point cloud opened in the browser
55%

of the technical staff surveyed depend on a specialist to analyze the data.6 of 11 technical staff · Miravo research, October 2026

How it works

Four steps, all on record.

01

Build the project

With data from DataHub, in the same coordinate system and with the same permissions.

02

Measure and calculate

Distance, area, elevation, profiles, cross-sections and volume by sections or by surfaces.

03

See it in 3D

Map, 3D and point cloud in the browser, with CAD-style layers.

04

Talk at the spot

Alert, question or task at the exact place on the map, with mentions and status.

For technical staff

Open and analyze in the browser, without waiting for the specialist.
For managers

The team's open items and decisions stay recorded in the project.

Specifications

What ProColab does.

Tools
Layered vectors, DXF, distance, area, elevation, profiles, cross-sections and volume
Views
Map, 3D and point cloud, with a 360° view per station
Collaboration
Real time, conversations at the spot on the map, mentions, notifications and status
Output
DXF, SHP, KML, GeoTIFF, LAZ and an elevation spreadsheet
Where
Browser and phone, with Miravo GO
FAQ

About analysis and collaboration.

How do you view LAS, LAZ and E57 point clouds online?
In ProColab, right in the browser: the point cloud opens in 3D, with coloring and measurement, and for E57 laser scanner data, with the 360° view of each station. No viewer needs to be installed.
How do you create longitudinal profiles and cross-sections online?
In ProColab, by drawing the alignment on the terrain model: the profile and cross-sections come out in the browser, with elevations and distances, and can be saved to the project or downloaded.
How does a team collaborate on the same survey?
In ProColab everyone sees the same layers, measurements and changes as they happen, and talks at the exact spot on the map, with an alert, question or task, mentions and an open or resolved status.
How do you open a point cloud or an orthophoto without installing software?
In the browser. At Miravo the heavy processing happens in the cloud, and ProColab opens point clouds (LAS, LAZ and E57), orthophotos and terrain models in map, 3D and point cloud views, on an ordinary laptop. In the field, the Miravo GO app works on the phone, even without signal.
All questions →
Next step

See ProColab with a survey from your operation.

A 30-minute online demo, with a survey from your operation on the map.

Request a demo